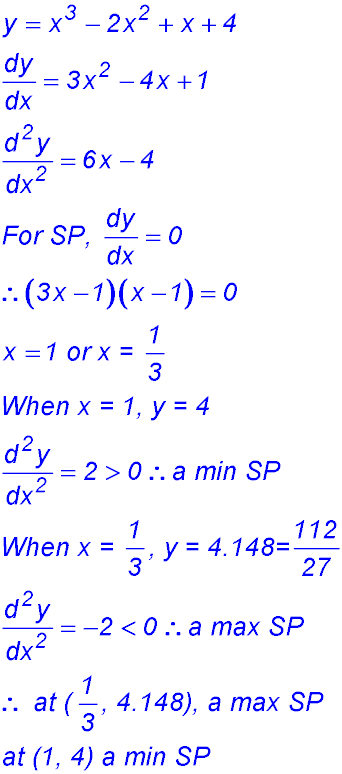
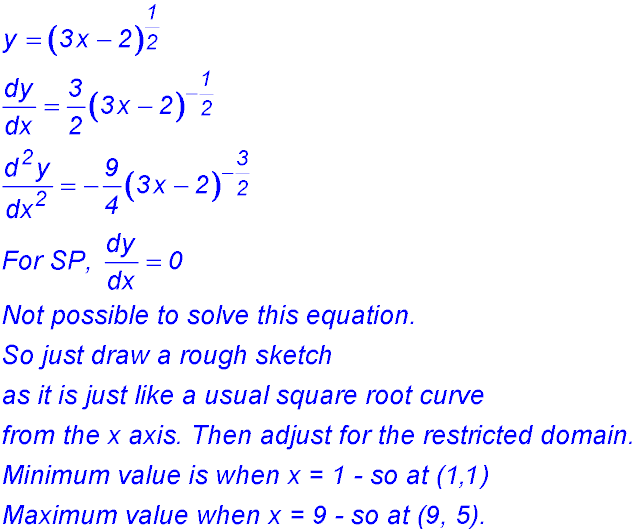
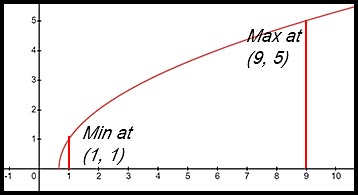
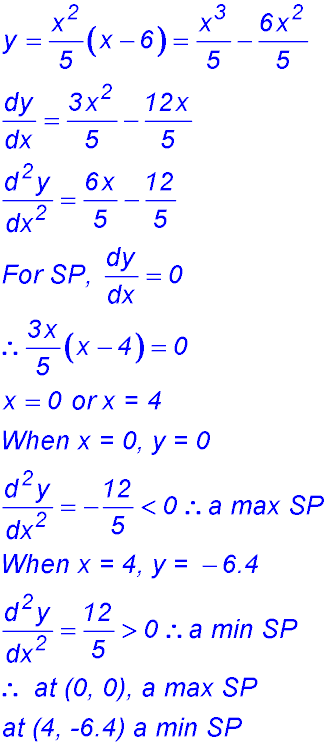
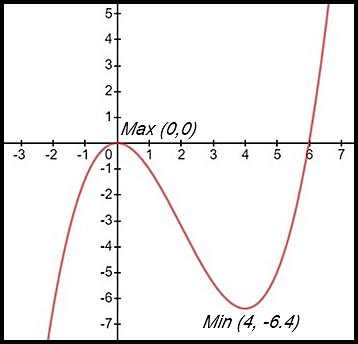
| Minimum & maximum values. |
1. For y = x3 - 3x2 - 9x + 1, find the coordinates of any turning points and determine their nature.
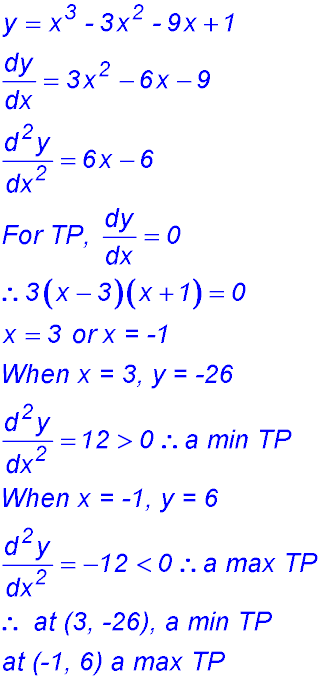
|
(ii) Points of inflexion.
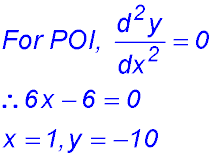
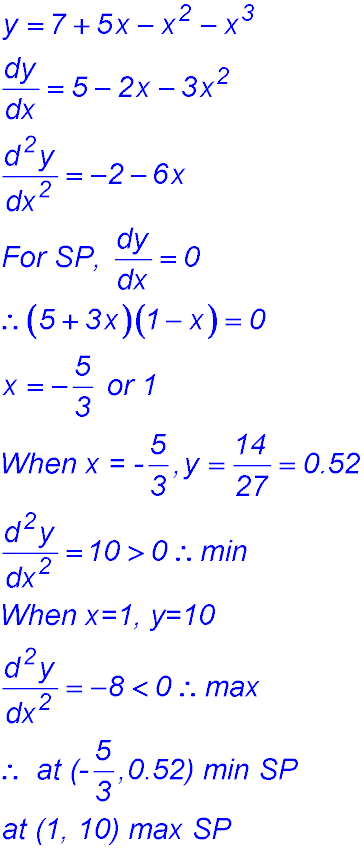
So a change of concavity. POI is at (1, -10).
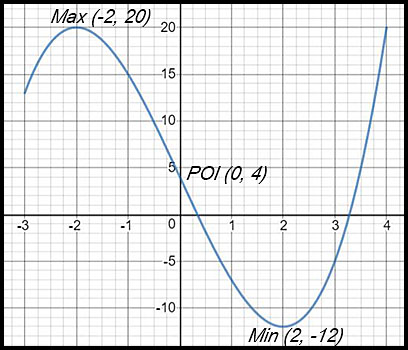
(iii) Sketch the curve.
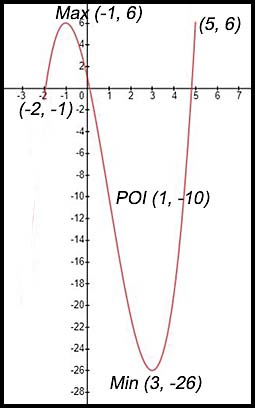
(iv) The minimum value of the function in the given domain is -26.
NOTE: Do NOT give the x value - it is just the minimum value of the curve!!
|
| |
2. 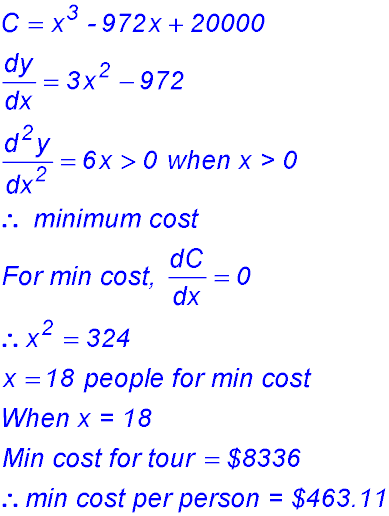 |
|
| |
3. (i) 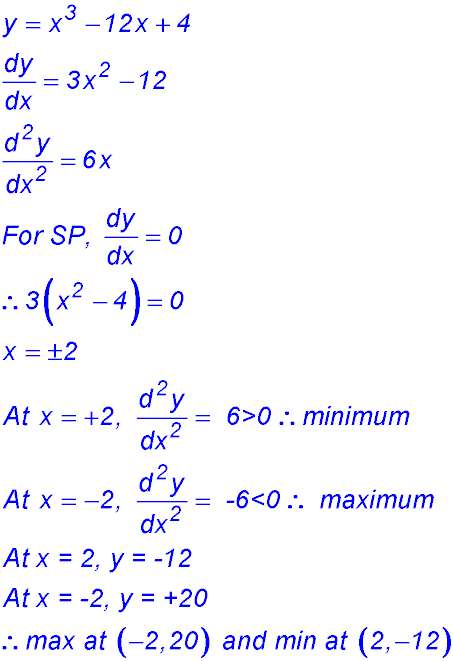 |
(ii) 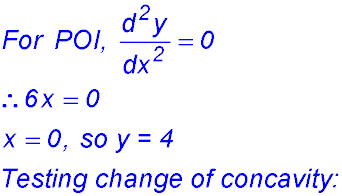
So a change of concavity. Point (0, 4) is a point of inflexion.
(iii)
|
| |
4. 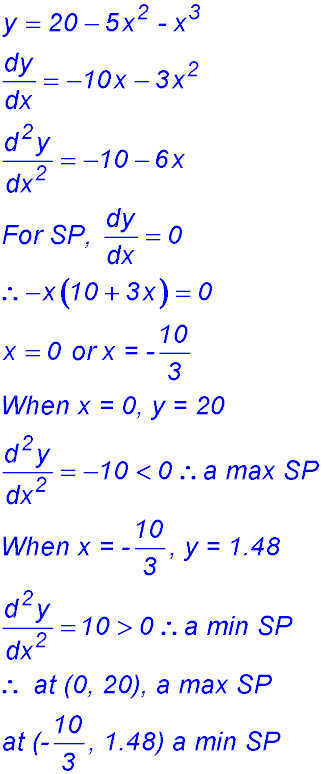 |
(ii) 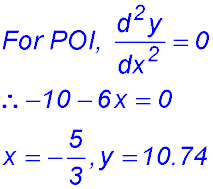
So a change of concavity.
Point (-5/3, 10.74) is a point of inflexion.
(iii) 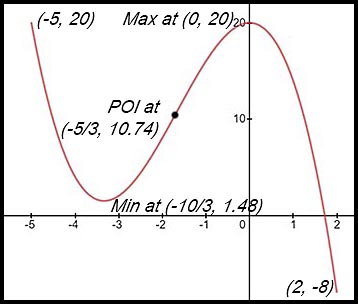
|
| Absolute max/mins. |
5. (i) 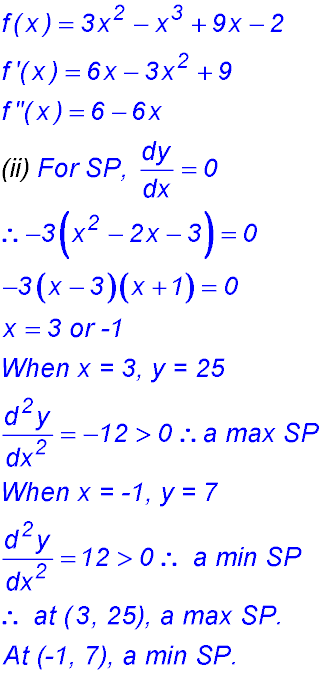 |
(iii) 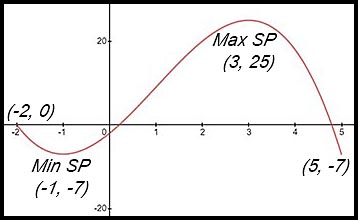
(iv) The minimum value for the function
is -7 and that value occurs twice
(at x = -1 and at x = 5).
|
| |
6. |
|
| |
7.  |
(ii) 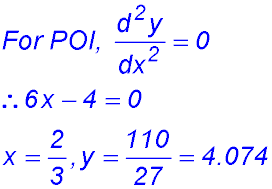
(iii) x intercept: x = -1.
y intercept: y = 4.
(iv) 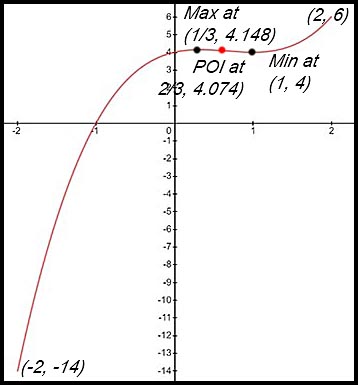
(v) Maximum y value in [-2, 2] is 6. |
| |
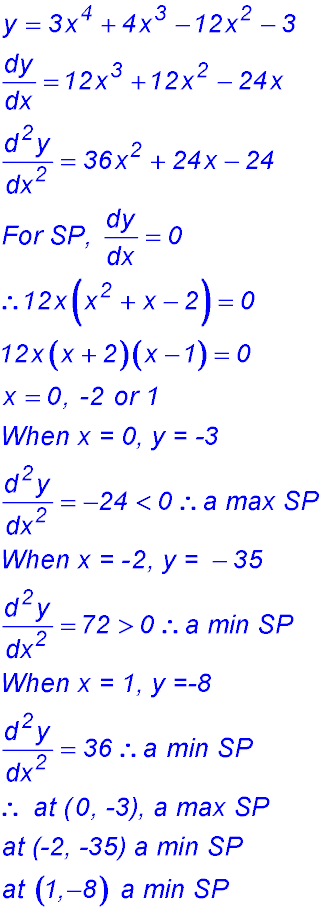
8.  |
(ii) Points of inflexion when
2nd derivative = 0.
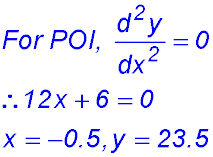
So a change of concavity.
POI is at (-0.5, 23.5).
(iii) 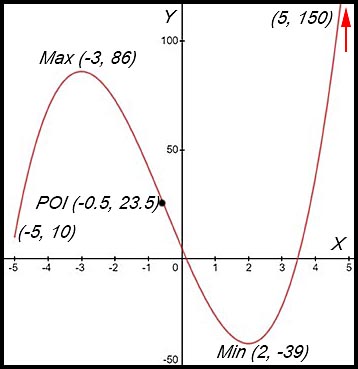
(iv) Maximum value in the
domain [-5, 5] is 150.
|
| |
9. (i) & (ii) |
|
| |
10. 
| 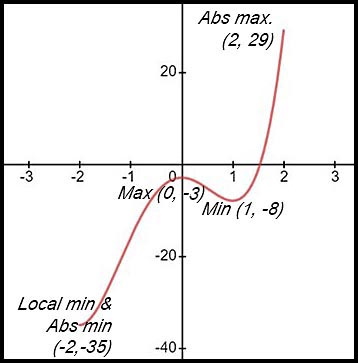
The local minimum and the absolute minimum within the domain [-2, 2] are -35 and both occur at x = -2.
The local maximum is -8 at x = 0 while the absolute maximum within the given domain is 29.
|
| |
11. 
|
| |
12.  |
 |
| Curve increasing/decreasing |
13. 
|
(ii) Sketch the graph of y = f(x) showing all its essential features including stationary points and intercepts.
(iii) For what values in the domain is the curve decreasing?
Curve is increasing for 0 ≤ x ≤ 4. |
| |
14. (i) 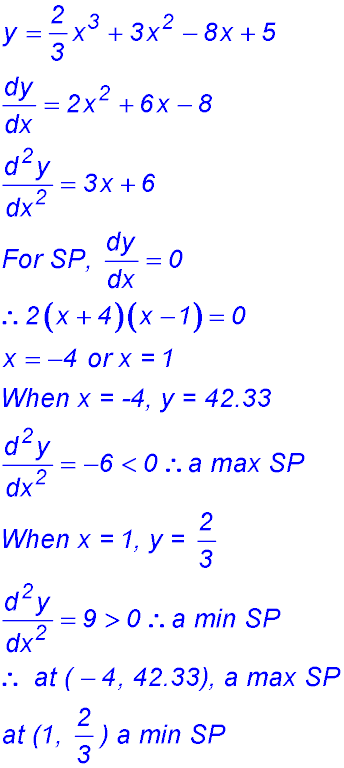 |
(ii) 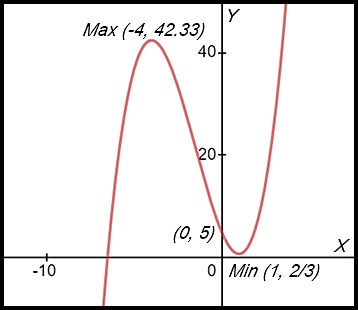
(iii) The curve is rising when:
x < -4 and when x > 1.
Note: answers expressed as < or > NOT as≤ or ≥
as at the equalities, the gradient equals zero and so is neither rising nor falling.
|
| |
15.  |
16.  |
| Concavity. |
17. 
|
(ii) 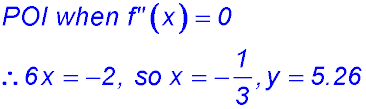
Change in concavity around x = -1/3, so a point of inflection at (-1/3, 5.26)
(iii) 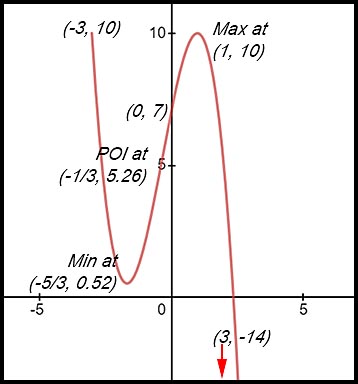
(iv) The curve is concave down after the POI (NOT including).
Hence x > -0.33. |
| |
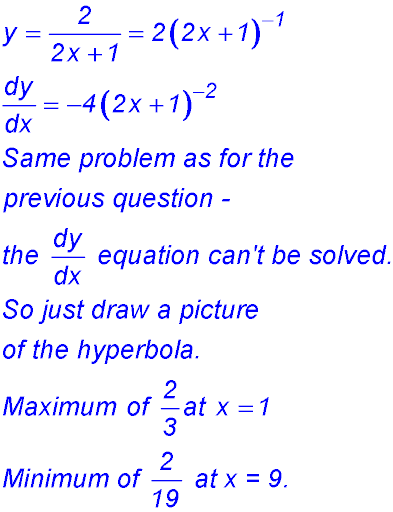
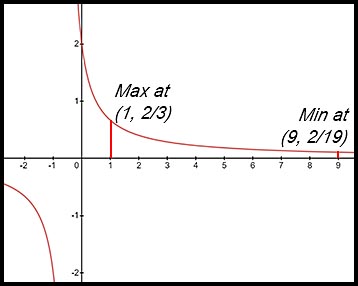
18. 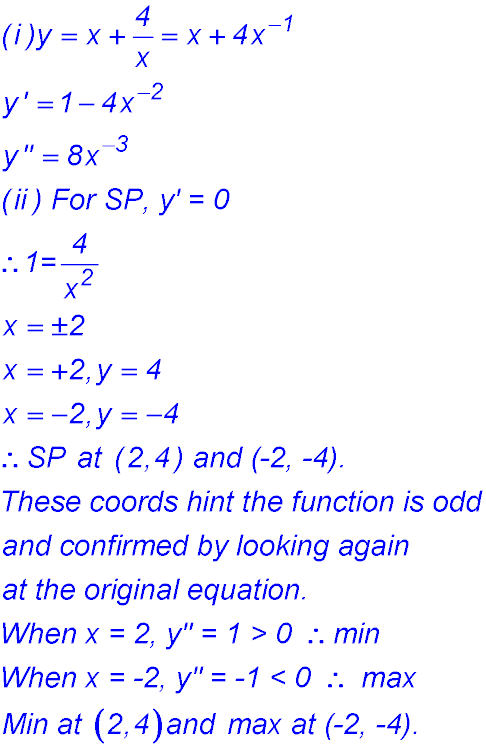
|
(ii) 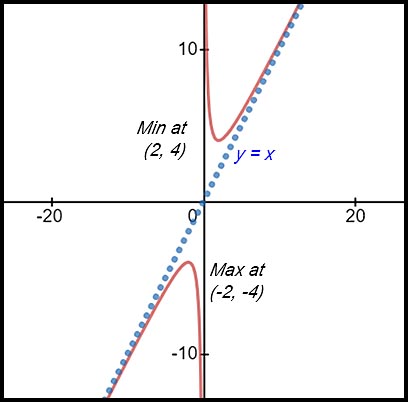
An unusual curve. Plot the two points and show they are max/min. Oops - they are going the wrong way.
Look back at the equation. It has a 1/x term - so it reflects a hyperbola. It cannot cross the y axis.
As x approaches 0, y approaches a big number (because of the reciprocal). As x approaches a big number, y approaches the x value (i.e. the line y = x) because the 2nd term approaches 0.
These ideas apply to both the 1st and 3rd quadrants. SO, the graph is as follows:
(iii) The curve is concave up for x > 0. |
| Point of inflexion. |
19. (i) 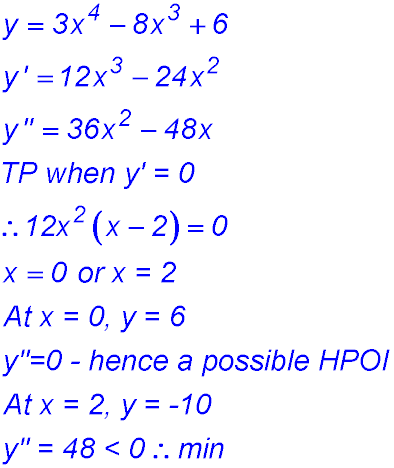
Change in concavity around x = 0 where 1st and 2nd derivatives = 0 - hence a horizontal point of inflection at (0, 6). |
(ii) 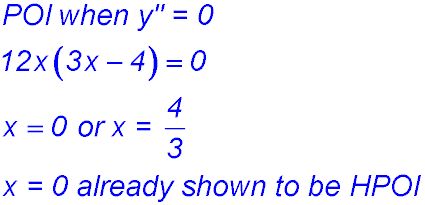
Change of concavity around x = 4/3 - so a normal POI is at (4/3, -3.48).
(iii) 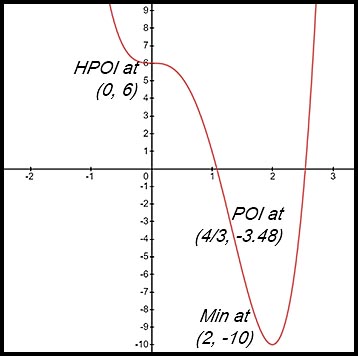 |
| |
20. (i) 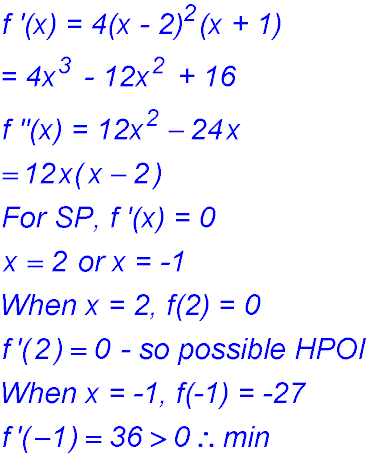
The table shows a change of concavity around x = 2 where the gradient was zero - hence there is a HPOI at (2, 0).
There is also the minimum point at (-1, -27).
(ii) 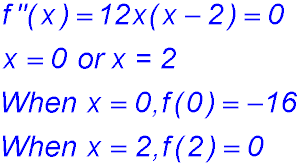
(2, 0) has already been shown to be a HPOI.
Change of concavity around (0, -16) so a POI.
|
(iii) 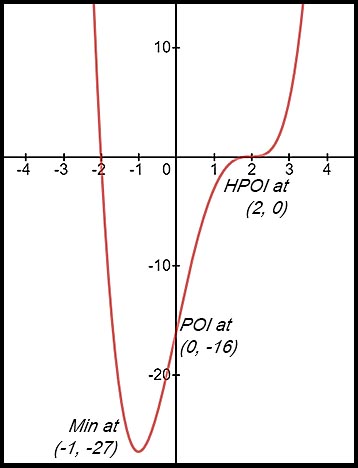
(iv) 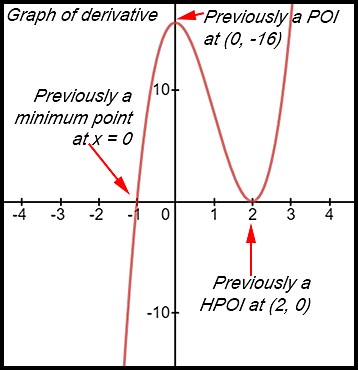 |
| Number of solutions. |
21. (i)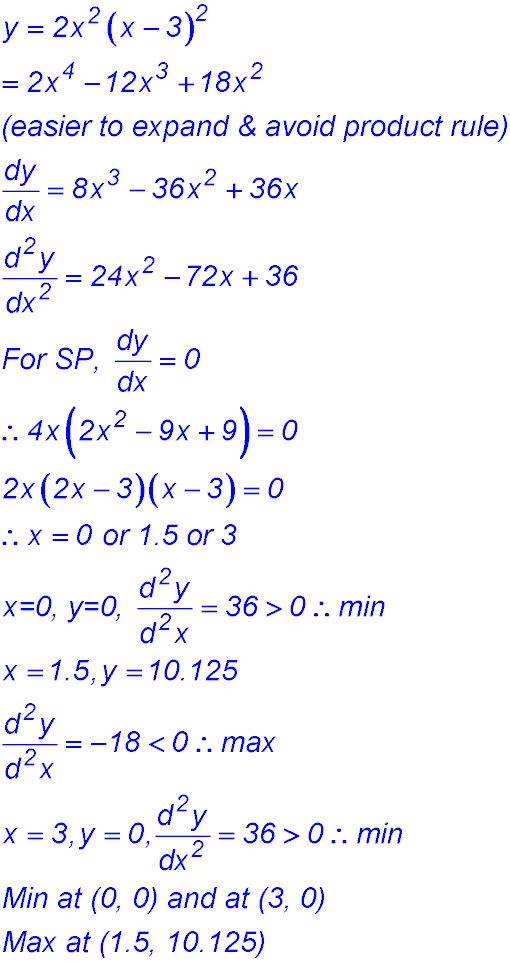 |
(ii) 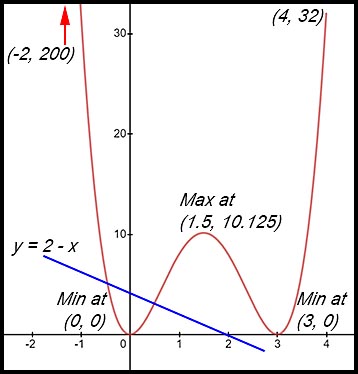
(iii) To find the number of solutions, the equation for the curve can be replaced with y to obtain y + x -2 = 0 (the 0 says the two equations will meet at the same points).
Hence the number of points of intersection (ie solutions) is 2. |
| |
22. (i)  |
(ii) 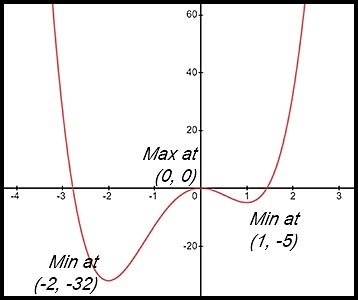
(iii) For the function to be increasing,
-2 < x < 0 and 1 < x.
(iv) We have the intersection of two lines/curves here.
Let f(x) = 0 to represent the intersections.
Replace the quartic equation with y.
Now we have y + k = 0 so y = -k which is simply a horizontal line.
So the question reduces to "where can we draw a line which does not cut the curve"?
It is anywhere below y = -32. So k < -32.
(iv) Draw a horizontal line to cut the curve in three places. Such a line will touch the max value for y (= 0) and the higher minimum value (= -5).
So k = 0 or k = -5. |